Web Client Tutorial
The Tethys web client is a browser-based interface to the server component of Tethys. It provides the ability to:
- Query Tethys and examine or download results.
- Import data from text files, spreadsheets, and databases.
- Design import maps; specifications of how fields in an external data source map to Tethys data.
- Access documentation
- See lists of the documents submitted to the database and/examine or download the data contained in each submission.
For general browsing of the contents of a Tethys database, many users may prefer to use the Data Explorer tool.
One can access the web client by typing the following into a browser’s address/location/URL bar. The address will vary depending on your Tethys server (ask your administrator), but generally looks like the following:
server:port/Client
where server is the name of your Tethys server (e.g., tethys.ourlab.instiution.edu), :port is the port number on which the service runs, and /Client indicates that you wish to access the web client. If your server is on the same machine as the web browser you are using, you may use the name localhost as the server. By default, Tethys uses port 9779, but this is a configurable option and your administrator may have chosen to run it on a standard port (web servers use port 80 for unencrypted text and port 443 for encrypted text).
Thus, if your server and browser are on the same machine, you might use:
localhost:9779/Client
as the web address. This tutorial only covers querying, see the list of help for information on importing data, designing data import maps and querying documents.
Queries
The web client supports basic and advanced query functionality, represented in the default “Simple Queries” and “Advanced Queries” views.
Simple Queries
The simple query view lets one query for data using a limited number of selection criteria. The view lets one query based on taxa, project name, site name or latitude/longitude bounding box, and by time. The advanced queries view lets one specify more sophisticated queries such as filtering on detection algorithms, sample rate, etc.
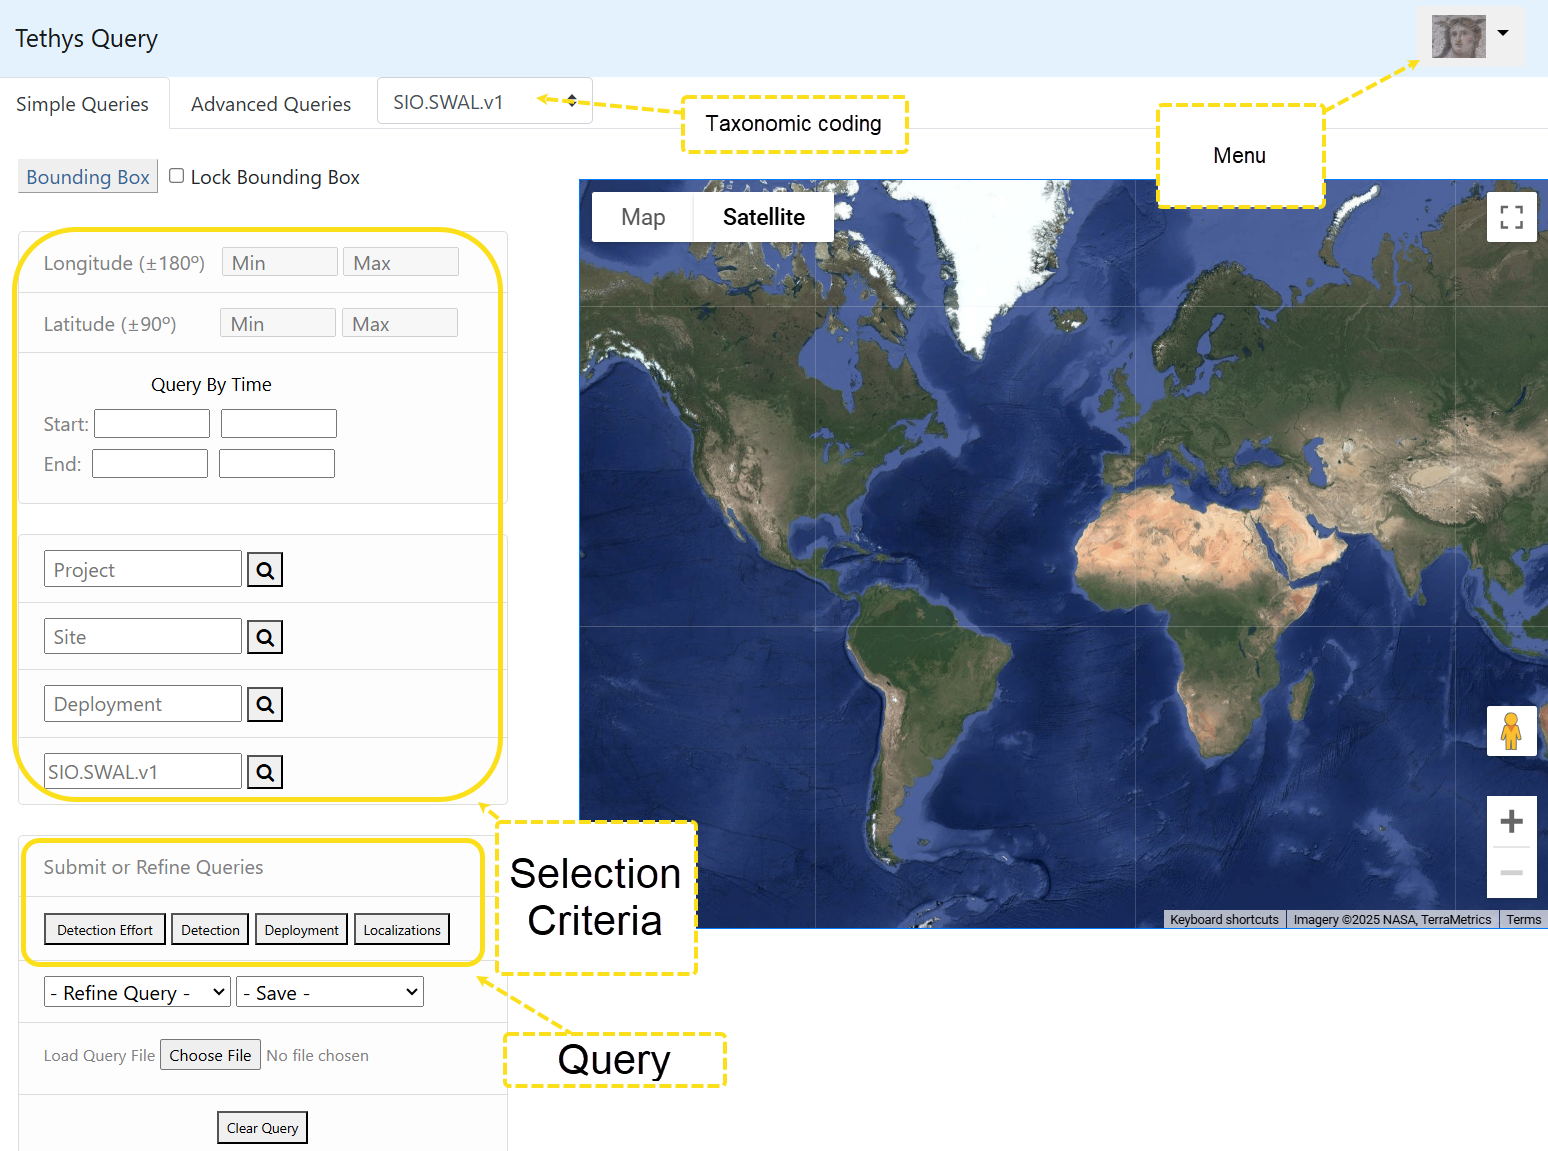
When the web client opens, your view will look much like the figure below without the yellow callouts.

Selection Criteria
The selection criteria provide a method to filter what is returned. There are a number of different fields that can be populated that affect what is returned in a query.

Spatiotemporal criteria
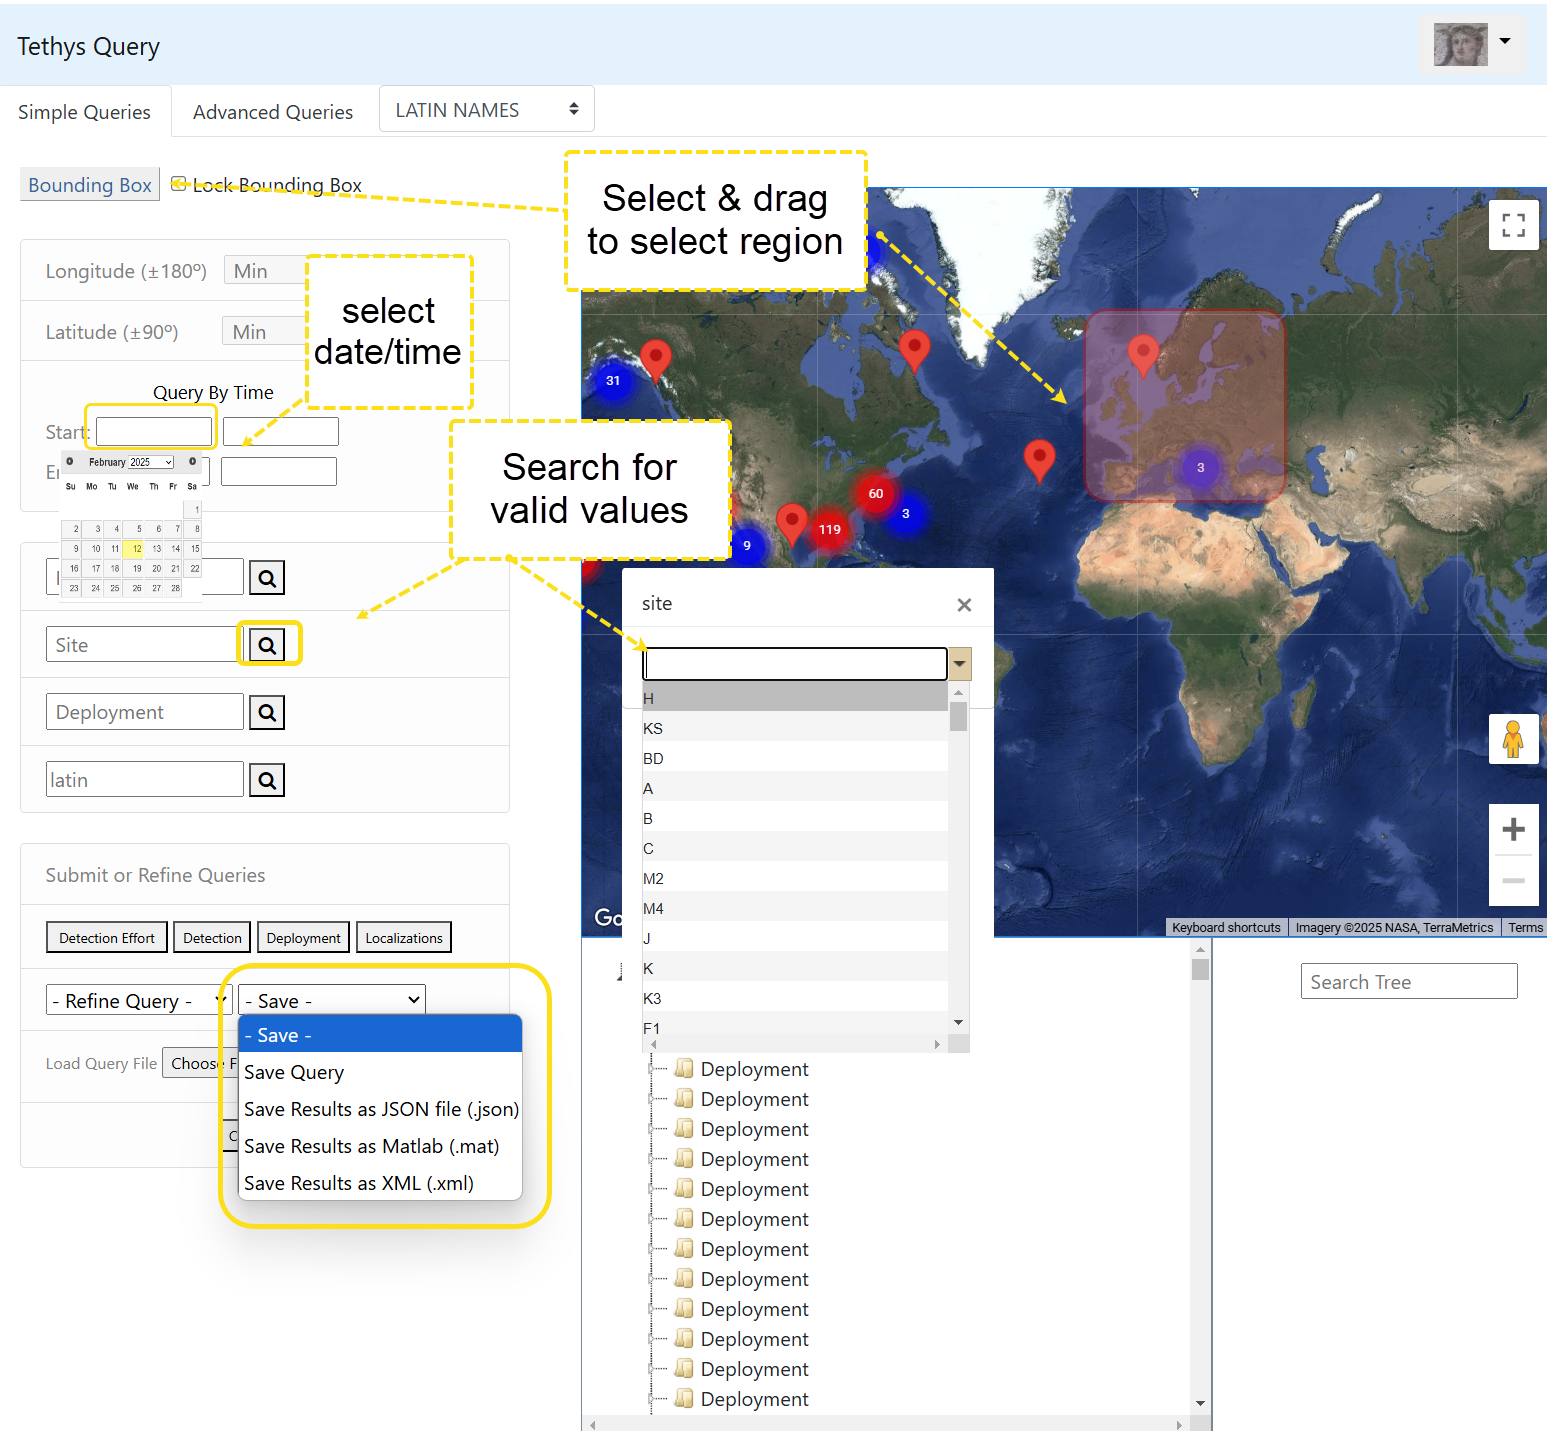
Rectangular spatial filters can be enabled by populating the longitude and latitude boxes. Alternatively, one can click the Bounding Box button to enable a rectangle that can be moved and resized. Note that the bounding box dimensions can change when moving the map. To prevent this from happening, select “Lock Bounding Box.”
Temporal filters are set by setting the boxes in the Query By Time section. All dates and times are interpreted in universal coordinated time (UTC) and with a 24 hour clock (16:00 instead of 04:00 PM). The boxes can be typed in directly or one can use the pop-up calendar and time.
Project management criteria
Instrument deployments are frequently associated with a specific project or site. The Project and Site fields permit selection of these. Project denotes a group of deployments that are related, usually by funding source, purpose, or geographic region. Site typically denotes a named place to which instruments may be deployed multiple times. This can be an internal name meaningful to the project (e.g., “A”) or a geographic one (e.g., “Tanner Banks”). Clicking the magnifying glass button will create a popup with a list of values that are used in the database. You can scroll to select or start typing to have the list filtered. Once a value is selected, either press the close box (x) or click anywhere off the popup to dismiss it.
The list of items brought up by the magnifying glass is filtered based on the values that have already been populated. Thus, if we had selected Project Aleut in the demonstration database, the search box for Site would only show sites that are associated with the Aleutian islands project.
Taxonomic criteria
When querying for detections, the taxonomic criteria box permits the specification of a taxon. The taxonomic coding selected at the very top of the web page dictates how the taxon is specified.
If Latin names are selected, Latin genera should be used, such as Lagenorhynchus obliquidens for Pacific white-sided dolphins. The Integrated Taxonomic Information System maintains a list of valid taxa and Tethys uses a snapshot of this database for taxonomic information.
In addition to Latin names, groups can define their own coding system. Several groups coding systems are distributed with Tethys, and it is possible for groups to define their own. Specifying your own coding system does not prevent sharing of data, taxonomic information is stored using ITIS’s taxonomic serial numbers (TSNs) regardless of what coding system is used. For information on creating a custom coding system, see the section on Species Abbreviations Documents in the Tethys manual. To see the contents of a specific coding system, select Species Abbreviations from the Tethys menu and click on the desired abbreviation set.
The expected coding system is shown in the search box when it has not been populated, making it easier to remember how a taxon should be specified.
Submitting Simple Queries
Once any desired criteria have been set, a query can be run. There are buttons for several common types of queries:
- Deployment - Report instrument deployments matching the criteria.
- Detection Effort - Report systematic attempts to detect bioacoustic phenomena.
- Detection - Report acoustic detections.
- Localizations - Report location information of bioacoustic phenomena.
Pressing one of these buttons starts the query process. Very broad queries, such as to report every detection in the database, will take a while to complete, and it is generally wise to restrict queries in some way. Results are stored for a while on the server for a while, so rerunning a large query is frequently faster than the first time it is run.
Results are shown in two ways:
- A hierarchical tree showing the records and values that have been returned. This is useful for looking at the structure of the data, but not for looking for trends. This is better done by downloading the data and analyzing it or looking for trends in the data explorer client. A “Search Tree” box lets one search for specific values.
- A map that shows where the data were observed. When data are too close to one another, they are clustered and displayed as a single balloon with a number. The number indicates how many groups of data were at this location. A group of data is a deployment, a set of detections, etc. Zooming in/out dynamically adjusts the clusters. Support for localizations is currently limited to animal tracks recorded using a WGS 84 coordinate reference system.
Due to browser memory limitations, very large results may not be displayed. When this occurs, a message will be shown in the results area indicating that display is unavailable, but the results may still be downloaded.
Saving queries and query results
The current query or its results may be saved to a file from the save menu drop-down in one of the following formats:
- XML - extended markup language. A document markup language used for information interchange. This format is machine readable and most programming languages have libraries to process the data.
- JSON - Javascript object notation. An alternative data representation scheme that requires less space than XML. Like XML, JSON processors are available for most languages.
- MATLAB - Saves a MATLAB .mat file (data structure readable by MATLAB).
- Save query - Does not save results, but saves the query filter values to a file so that it may be loaded with the Load query file button.
Users running a Tethys server without encryption may be asked to approve downloads.
Refining queries (advanced)
The simple view is limited and cannot provide complex filtering such as looking for detection effort on equipment that had a certain sample rate or used a specific algorithm. For that, the advanced queries mechanism is needed. One can populate data in the simple view and use the refine query drop-down menu to transition to advanced view with some of the fields prepopulated. The refine query menu asks how the query should be treated (deployment, detection effort, detection, or localization query) and prepopulates the selected criteria along with a list of commonly returned data for that type of query.
Advanced Queries
The advanced queries view provides a method to generate sophisticated queries from a graphical web-based user interface. One accesses this interface by either clicking on the advanced queries tab or using the refine query drop-down menu from the simple queries interface. The interface has four tabs:
- Build - Used for constructing queries
- Query - Show the query that corresponds to the current parameters on the build tab. This is useful for building sophisticated queries to embed in programs.
- Map - Plots current results on a map.
- Results - Displays the current results (XML)
Build
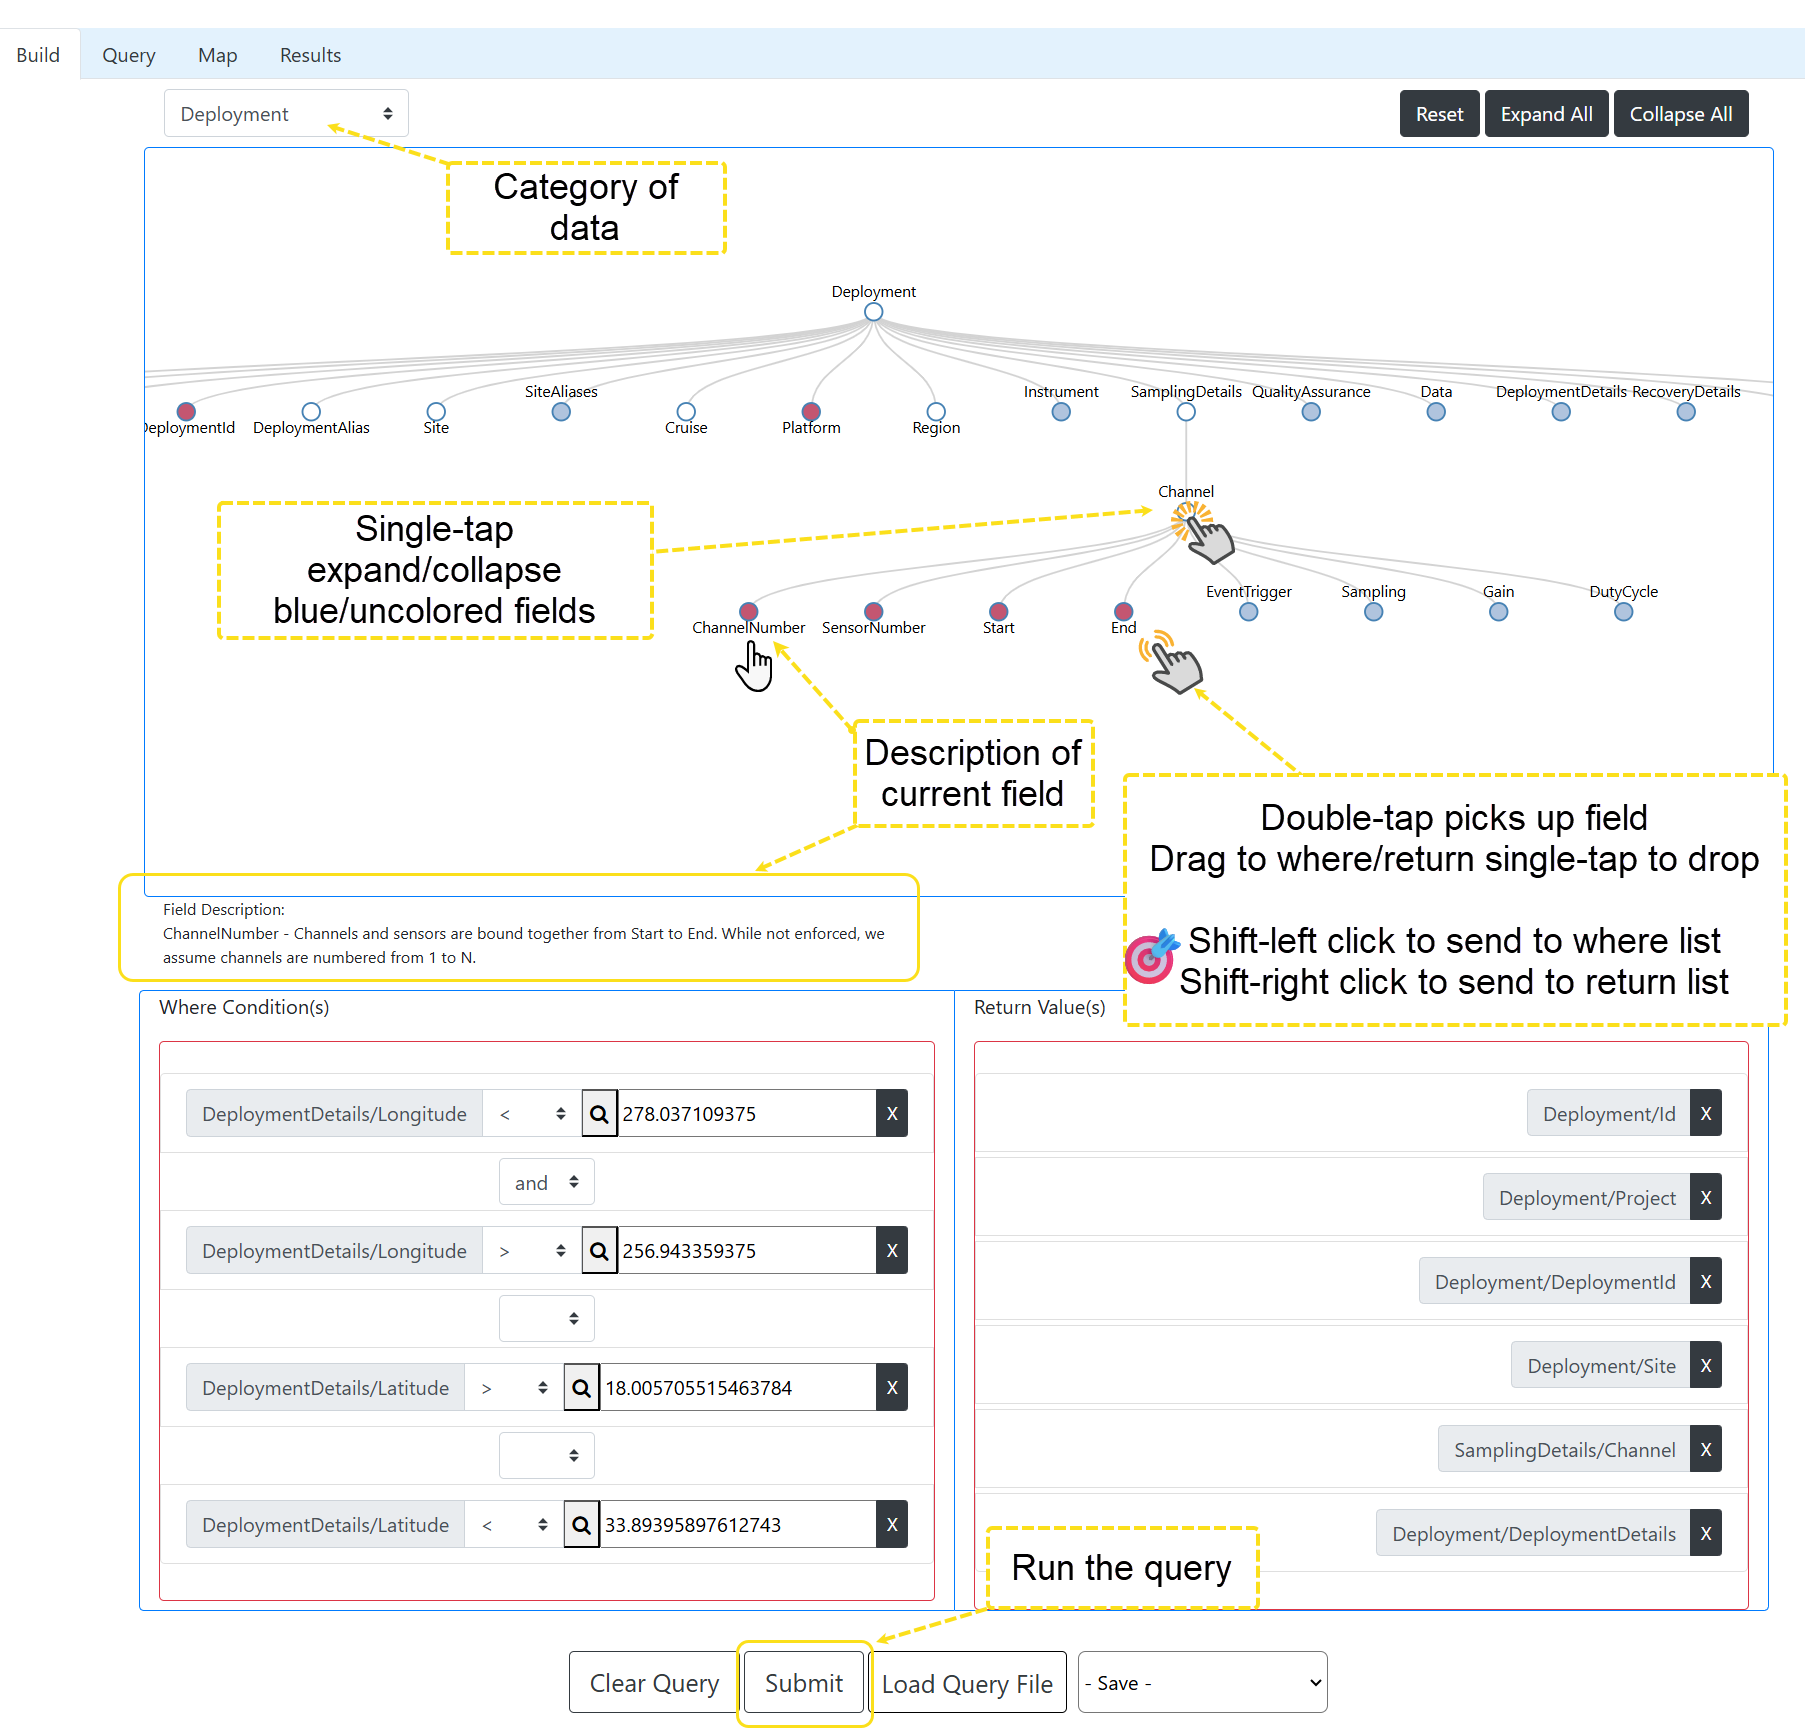
The build tab is the starting point for constructing advanced queries. It consists of three major areas. The upper panel allows one to select a Tethys collection, or category of data to query, and displays the schema associated with that collection. The bottom-left panel is a set of selection criteria that will be used to execute the query. The bottom-right panel shows the data that you would like returned from the query.
Schema (upper panel)
The figure below shows the fields associated with deployments. It is a tree view where each field or record is represented by a node in the shape of a circle. These circles are color-coded:
- blue - Has children, single-clicking will expose the children after a brief delay (as we will see later, double-clicking has a different behavior)
- white - Expanded node, if there are no children, the field is optional. Children can be collapsed by single-clicks.
- red - Required field, valid records require this to be populated. Sometimes a field is populated within a record, but the record is not required. For example, duty cycles are represented by the required fields RecordingDuration_s and RecordingInterval_s. The duration indicates how much time is spent recording while the interval indicates the period. For example, a 50% duty cycle over a 30 min period would have an duration of 900 s (\(15 \times 60\)) and interval of 1,800 s (\(30 \times 60\)). When data are duty cycled, these two fields are mandatory. In contrast, continuous (non-duty-cycled) data will not include the DutyCycle record at all.

Hovering the mouse over a node populates a description for most nodes. The panel can be panned by clicking and holding your mouse on a blank portion of the display and moving the mouse. Zooming in and out is accomplished by the mouse wheel. Three buttons at the top allow you to reset the view, or expand/collapse all nodes.
A double-click on a field will pick it up to be used in the where and return panels. If you pick something up by accident, just click in a blank area to drop it without changing anything.
Conditions (lower-left panel)
When items are dragged to this panel, a new row will appear. Each row consists of a field name (parent-name prepended), a selectable comparison operator in a drop-down menu, and a value box. As in the simple query view, a magnifying glass allows searching for values that are contained within the database. Finally, a \(\times\) icon can be used to remove a row if it is no longer needed.
You can quickly add a field to the set of conditions by holding left-shift while clicking.
Return (lower-right panel)
Like the conditions panel, items can be dragged to this box as well. Each item that is added represents data that will be returned in the query. When an item has children in the schema panel, that item and all of its children will be returned in the results.
You can quickly add a field to the set of data that are returned by holding Right-shift while clicking.
Using multiple schemata
When there is a clear correspondence between collections, such a set of detections or localizations and the deployment that was associated with these detections, selection or return criteria from more than one collection can be used. Simply change the collection name from the pull-down menu at the top and pick the new collection. Tethys will automatically add additional criteria to join these documents and return data based on the correspondence, such as the instrument deployment longitude and latitude associated with a set of detections.
Querying
Once the conditions and return items have been selected and set, we can run a query. The bottom of the advanced queries view has the following options:
- Clear Query - Removes all items from the condition and return lists.
- Submit - Executes the query. When it completes, the progress indicator will go away and a brief message indicating that the query has completed will be displayed.
- Load Query File - Retrieve a previously saved query
- Save - This menu button offers the following choices:
- Save Query - Save conditions and return items to be used again at a later date.
- Save Results as JSON - Save results as Javascript object notation (JSON)
- Save Results as MATLAB - Save results as a .mat file that be loaded with MATLAB’s load command.
- Save Results as XML - Save results as an XML file.
The tabs at the top of the window (Query, Map, and Results) are related to queries.
Query tab
The selection and return criteria associated with a query are used to write queries that the Tethys server can understand. Most users do not need to look at this tab.
On occasion, one may wish to use the graphical system to design a query for use by a client in a programming language. The Tethys server supports two ways to do this, both of which are documented in the Tethys Server Interface manual.
The first method is to design a JSON dictionary that is passed to the Tethys server using a function in one of the client libraries (e.g., the Java client’s Queries.QueryJSON method) or via Tethys’s RESTful interface.
The second method is to design a query in the XQuery language, which is used by Tethys’s underlying database. XQuery is more expressive than graphical interface, and if you have a particularly complex query, it may be helpful to use the web client to generate the basis of the query and then to modify it slightly.
The Query tab shows how the current query can be represented for both the JSON and XQuery interfaces.
Map tab
This shows a map similar to the map in the simple view.
Results tab
Displays the XML output. Unlike the simple view, a tree is not generated.